How to Debug Code Like a Seasoned Pro
Learn how to debug code with proven techniques and a systematic workflow. Discover the right tools and mindset to solve bugs faster and more efficiently.
Learning to debug code effectively isn't about memorizing a hundred different commands. It's about shifting your entire mindset from reacting to errors to systematically hunting them down. The core of it is a simple, repeatable loop: reproduce the bug consistently, form a smart guess about what’s causing it, and then use your tools to prove or disprove that guess. This turns a frantic, frustrating bug hunt into a structured, solvable puzzle.
Adopting a Problem-Solving Mindset for Debugging

Before you ever type print() or set a breakpoint, the real work of debugging starts between your ears. You have to move past just chasing symptoms—the random crashes or weird UI glitches—and start methodically investigating the root cause. This investigative approach is what really separates an experienced developer from a junior one.
There's a good reason to invest time in this mental framework. Most programmers spend a staggering 30% to 50% of their time just tracking down and fixing bugs. Getting better at this one skill can have a huge impact on your project's timeline and your own sanity. You can dig into the to see just how much it matters.
The First Rule: Reproduce the Bug Reliably
You can't fix what you can't see. A bug that only happens "sometimes" is a nightmare to solve with any confidence. Your first mission, and it's non-negotiable, is to find a set of steps that makes the bug show up every single time.
This usually involves a few key actions:
- Document the Steps: Write down exactly what you did. What buttons did you click? What data did you enter? What was the state of the system?
- Isolate Variables: If there are a bunch of things happening at once, try changing just one thing at a time until you find the exact trigger.
- Create a Minimal Test Case: Your goal is to build the smallest possible snippet of code or the simplest set of inputs that still causes the problem.
Once you can make the bug appear on command, you've already won half the battle. This is an immediate, actionable opportunity to use an AI tool like . By feeding it the error message and your reliable reproduction steps, you can get an initial analysis and a few potential theories before you even open a source file, saving you valuable investigation time.
"The most effective debugging tool is still careful thought, coupled with judiciously placed print statements." — Brian Kernighan, Co-author of 'The C Programming Language'
Form a Hypothesis Before You Change Anything
Fight the impulse to just start tweaking code and hoping for the best. Stop. Think. Based on what you see and what you know about the code, form a clear, testable hypothesis.
For instance, "I think the user's shopping cart fails to update because the inventory API call is timing out, but only when the server is under heavy load."
This simple act focuses your entire investigation. You're no longer just guessing; you're running a scientific experiment to prove or disprove a specific idea. This methodical approach is the bedrock of learning how to debug code like a pro.
Building Your Modern Debugging Toolkit
We’ve all been there, sprinkling
print() statements through our code like breadcrumbs, hoping to trace a bug's path. While it’s the classic starting point, relying on it alone is like navigating a new city with a folded paper map instead of GPS. It might work eventually, but it's slow, messy, and you'll miss a lot along the way.
To really get ahead of bugs, you need a toolkit that lets you peer inside your code while it’s running. This isn't just about fixing what's broken; it's about building an intuition for how your code behaves, preventing issues before they even start. It’s a skill set with growing demand, too—the global software debugging market was valued at USD 3.5 billion in 2023 and is projected to reach USD 7.2 billion by 2032. You can to see just how fast this space is growing.
Your First Big Upgrade: Interactive Debuggers
The single biggest jump you can make from print() debugging is to master an interactive debugger. These powerful tools are already built into the IDEs you use every day, like , , or PyCharm.
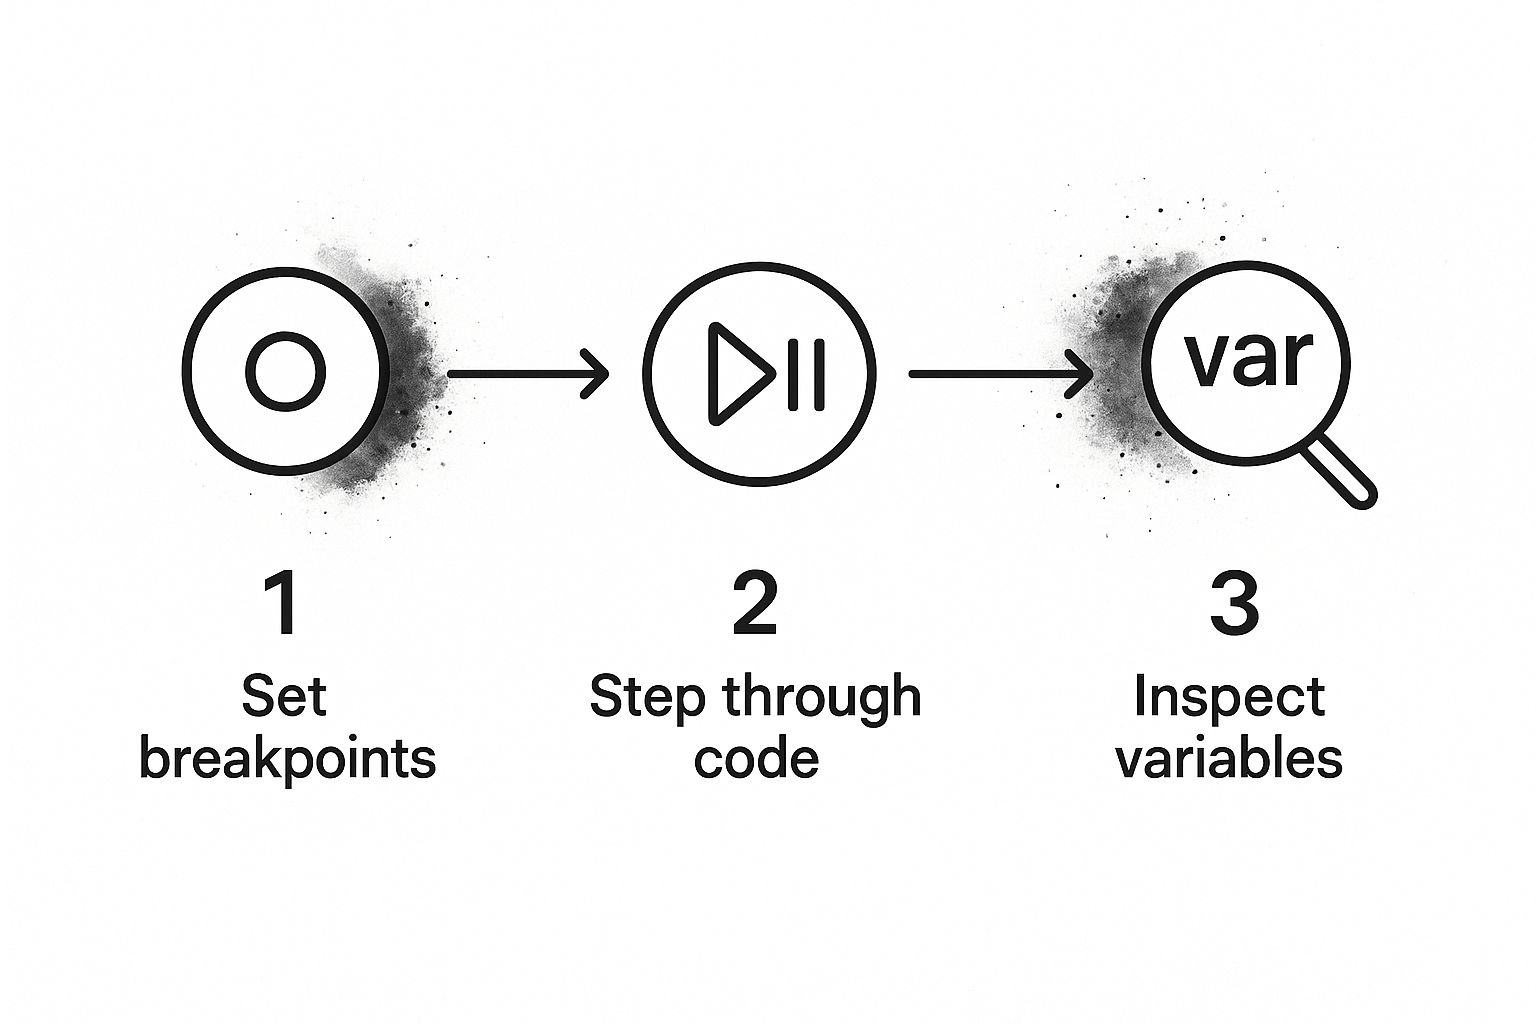
Instead of just printing a variable's value and guessing, a debugger gives you total control:
- Set Breakpoints: Pause your program's execution on any line you choose.
- Inspect Variables: See the live value of every variable in scope the instant the code pauses.
- Step Through Code: Walk through your program one line at a time, watching the logic unfold right before your eyes.
This isn't just for squashing bugs. It's for truly understanding your code. You can literally watch a variable flip to an unexpected value or see an if statement take the wrong branch. It’s like having x-ray vision for your application’s logic.
Comparison of Common Debugging Tools
Choosing the right tool often depends on the problem you're facing. Some situations call for a quick check, while others require a deep-dive investigation. Here's a look at how different methods stack up.
Ultimately, a well-rounded developer knows when to reach for each tool. Combining them is where the real power lies.
Shifting Left With Linters and Static Analysis
Why wait for a runtime error to ruin your day? The most efficient way to debug is to catch mistakes before the code is ever executed. This is where linters and static analysis tools become your secret weapon.
Tools like ESLint for JavaScript or Pylint for Python scan your code as you type, flagging everything from unused variables and style violations to common programming blunders. Think of them as a tireless automated peer reviewer, cleaning up your code and eliminating entire categories of bugs before they ever get committed.
A powerful toolkit doesn't just help you fix bugs; it helps you write bug-resistant code from the start. By combining proactive analysis with interactive inspection, you move from reacting to problems to actively preventing them.
The AI Force Multiplier
The real game-changer in a modern developer's toolkit is an AI partner. Traditional tools show you what is happening, but a good AI assistant can help you understand why.
This is where a tool like Zemith's Coding Assistant comes in. Instead of staring at a cryptic stack trace for an hour, you can paste it into Zemith and get a plain-English explanation of the most likely cause. For an actionable way to integrate this, try asking it to suggest precisely where to add intelligent logging statements to get more context, fast. If you want to see how this impacts your workflow, check out our guide on .
An AI assistant doesn't replace your skills; it multiplies their effectiveness, making your entire debugging process smarter and faster.
A Repeatable Workflow for Fixing Any Bug
The real secret to confident debugging isn't knowing every obscure command-line flag. It’s having a reliable, systematic process that takes you from a state of confusion to one of clarity. When you panic and start making random changes, you usually just create more bugs. A methodical workflow, however, can make even the most tangled problems feel manageable.
Let's walk through a classic scenario. A vague bug report hits your inbox: a user says their profile update "sometimes fails," but they can't provide any more detail. This is where a repeatable process saves you from a frustrating guessing game and turns it into a structured investigation.
Confirm and Isolate the Problem
Your first job is to get from "it sometimes fails" to "it fails every time I do X." You can't fix a bug you can't reliably reproduce.
Start by trying to replicate the user's reported actions. Can you make the bug appear consistently? You might discover it only breaks when a specific field is submitted, like a username containing special characters.
Once you can trigger the bug on command, it's time to isolate it. Is this a front-end validation issue? A problem with the API endpoint? Or is the database write failing? This is where your modern toolkit shines.
This simple loop—pausing the code, stepping through the logic line-by-line, and inspecting the state of your variables—is hands-down the fastest way to confirm exactly where your code is going off the rails.
Uncover the Root Cause
With the problematic code cornered, the real detective work begins. You need to understand the why behind the failure, not just the what. A rookie mistake is to just patch the symptom. For example, slapping a quick if statement on the problem to handle some bad data, without figuring out how that bad data got there in the first place.
This is a perfect time to bring in an AI partner. An actionable step is to ask Zemith's Coding Assistant: "Why would this function return null when the input is test-user?"
Zemith can analyze the function in its full context, often spotting a subtle logic error or an unhandled edge case you might have overlooked after hours of staring at the same screen. It helps you shift from simply observing the problem to truly understanding its origin.
"The art of debugging is figuring out what you really told your program to do rather than what you thought you told it to do." - Andrew Singer
That distinction is everything. By digging for the root cause, you don't just fix the immediate issue—you make the entire system more resilient.
Implement, Verify, and Prevent
Okay, now you can write your fix. Because you've pinpointed the root cause, your solution will be targeted and precise, not just a shot in the dark. But you're not done yet. The final, and arguably most critical, step is to make sure this exact bug can never, ever happen again.
You do this by writing a regression test. Before you even think about merging your fix, write an automated test that specifically reproduces the bug. Naturally, this test will fail. Then, after you apply your fix, it should pass.
This simple practice accomplishes two crucial things:
- Verification: It proves that your fix actually works.
- Prevention: That test becomes a permanent guard in your test suite, ensuring future code changes don’t accidentally reintroduce the same bug down the road.
If you’re new to this idea, our guide on is a great place to start building a solid testing strategy. For an immediate productivity boost, use Zemith to help you draft a solid unit test that locks your fix in place for good.
Tackling Advanced and Elusive Bugs
Not every bug is a simple fix. We've all been there—chasing those devious issues that only appear under a specific, maddeningly rare set of conditions. These are the bugs that keep you up at night: intermittent race conditions, subtle memory leaks, or problems that mysteriously vanish the moment you try to debug them locally.
When your standard workflow hits a wall, it’s time to change tactics. These bugs don’t play by the rules, so you have to expand your investigative toolkit beyond your local IDE. The real challenge is gathering context from the environment where the bug actually lives, even if you can't see it directly.
Peeking into Live Applications with Remote Debugging
What do you do when a bug only shows up in production? You can't just attach your local debugger and call it a day. This is where remote debugging becomes an absolute lifesaver.
It lets you connect your IDE's debugger directly to a running application on a server. Suddenly, you have all your familiar, powerful tools—breakpoints, variable inspection, step-through execution—but on the live code. It takes a bit of configuration to get going, but the payoff is huge. You can pause the application right when an error happens and inspect the actual state that's causing the problem. It’s the closest you can get to sitting inside your live server, watching the logic unfold.
Sifting Through Logs for Hidden Clues
Staring at a massive log file can feel like searching for a needle in a haystack. But those logs often contain the exact clues you need to solve an intermittent bug. The trick isn't to read every single line; it's to look for patterns and anomalies.
Start by looking for what isn't there. If a successful transaction always logs five specific messages, but your failing one only logs three, you’ve just found a huge lead. Use log analysis tools to filter and correlate entries around the time of an incident. This kind of methodical analysis transforms that wall of text into a clear story of what went wrong.
When you’re up against a complex bug, your first instinct should be to gather more data, not to start changing code. Logs, remote sessions, and even just talking through the problem are all forms of data collection that lead to a precise fix.
The Power of Explaining the Problem
Sometimes the best debugging tool you have is another person. Or, famously, an inanimate object. This technique, known as "rubber duck debugging," is surprisingly effective. It’s the simple act of explaining your code, line by line, to someone (or something) else.
Forcing yourself to articulate your logic out loud often shines a spotlight on the flawed assumption you've been glossing over for hours.
This is also where an AI partner can be an incredible asset for those really tough bugs. When you’re completely stuck, you can turn to an AI tool like Zemith's Coding Assistant. Here’s an actionable insight: try feeding it a complex stack trace or a confusing snippet from your logs. Zemith can chew through that verbose, cryptic information and spot anomalies a human eye might miss. Think of it as an ever-present senior developer you can bounce ideas off of, helping you see the problem from a completely different angle. This is especially useful for decoding things like race conditions or memory issues, where the root cause is often buried under layers of complexity.
5. Weaving Smart Debugging into Your Team’s Workflow

Great debugging isn't about one developer being a hero; it's about building a healthy engineering culture. In any fast-moving team, the real goal is to "shift left"—catching and squashing bugs as early as possible in the development cycle. It’s about treating debugging as a team sport, where shared knowledge and solid processes beat individual heroics every time.
Modern software development moves fast. The push toward Agile and DevOps means we need to find and fix issues quicker to release reliable code without slowing down. This isn't just about reacting to problems after the fact; it's about building quality into every step of the process. You can to see how deep this trend goes.
Building a Proactive Debugging Culture
A solid debugging culture doesn't just appear when a bug report comes in. It's built into the team's daily habits, with a clear focus on preventing problems before they start. Two practices, in particular, lay a strong foundation.
- Powerful Code Reviews: Stop treating code reviews as a simple checkbox. Turn them into collaborative debugging sessions. Instead of just spotting typos, reviewers should be asking tough questions about the logic, poking at potential edge cases, and challenging assumptions. This is your first and best line of defense.
- CI/CD Integration: Your CI/CD pipeline is a powerful ally. Embed automated checks directly into it. Every single commit should trigger static analysis, linters, and a full suite of automated tests. Finding a bug here is drastically cheaper and faster than fixing it once it's live in production.
When you make these practices the norm, you create a system that constantly vets and validates your code, which means fewer bugs ever make it to an end user.
The best teams don't just fix bugs faster; they build systems that prevent them from happening in the first place. This cultural shift from reactive to proactive is the hallmark of high-performing engineering organizations.
Creating Shared Intelligence for Your Team
For a team to be truly efficient, you need consistency in your tools and processes. When everyone has their own pet tools or a unique workflow, collaboration gets clunky and knowledge gets trapped in silos. Standardizing your approach creates a shared language and a collective intelligence that everyone can draw from.
This is exactly where a tool like Zemith's Coding Assistant can become a central part of your team's workflow. Integrating it gives everyone a consistent, reliable resource. Junior developers get instant, clear explanations for confusing errors, empowering them to solve problems that might have otherwise eaten up a senior dev's time.
Meanwhile, senior developers are freed from repetitive troubleshooting to focus on bigger architectural challenges. Zemith acts as a force multiplier, making sure accurate information is always just a query away. Of course, well-documented code is another critical piece of this puzzle; our article on has some great tips on that front.
Ultimately, this unified approach ensures that code quality and development speed can grow hand in hand.
Common Questions About Debugging Code
Every developer hits the same walls when hunting down bugs, no matter how long they've been coding. Let's walk through some of the most common questions and get you some practical advice to get unstuck.
What Is the Very First Step for a Confusing Bug?
The first thing you absolutely must do is figure out how to reproduce the bug reliably. If you can't make it happen on command, you're just guessing.
Nail down the exact steps, the specific inputs, and the environment that triggers the issue. Document it all. Once you have a consistent failure case, you have a solid starting point. An actionable first step is to drop the error message and context into an AI tool like Zemith's Coding Assistant. It can give you an initial analysis and point you in the right direction before you even look at a single line of code.
How Do I Fix a Bug Without Creating a New One?
The best way to prevent new bugs is to build a safety net before you start fixing the old one. This means writing a regression test.
Before you touch any code, write a simple, automated test that specifically replicates the bug. Naturally, it will fail. Now, as you work on the fix, keep running that test. The moment it passes, you know you’ve solved the problem. That test now becomes a permanent part of your test suite, ensuring this exact bug never creeps back in.
A fix without a test is just a guess. By writing a failing test first, you prove the bug exists and then prove your solution works, all in one motion. This practice is a cornerstone of building robust, reliable software.
My Bug Only Happens in Production—How Do I Fix It?
Ah, the classic "it works on my machine" problem. The key here is to close the gap between your local setup and the live environment. Your first move should be to dive into the production logs. They often hold clues you simply can't see on your own computer.
If the tools are in place, try to use remote debugging to connect directly to the application while it's running. When that's not an option, your next priority is to mirror the production environment as closely as you can locally, often with tools like . The issue is almost always a subtle difference in configuration, user permissions, data, or environment variables.
This is where an AI partner really shines. Here's a practical action: feed verbose production logs or stack traces to Zemith's Coding Assistant. It can sift through the noise to spot anomalies or suggest environmental factors you might have missed. Think of it as a second set of eyes that helps you find the needle in the haystack when the problem is invisible.
Ready to make your debugging process smarter and faster? The Zemith AI platform integrates a powerful Coding Assistant that helps explain errors, analyze logs, and generate tests, turning frustrating bug hunts into systematic problem-solving.
Explore Zemith Features
Every top AI. One subscription.
ChatGPT, Claude, Gemini, DeepSeek, Grok & 25+ more


Always on, real-time AI.
Voice + screen share · instant answers
What's the best way to learn a new language?
Immersion and spaced repetition work best. Try consuming media in your target language daily.
Voice + screen share · AI answers in real time
Image Generation
Flux, Nano Banana, Ideogram, Recraft + more

Write at the speed of thought.
AI autocomplete, rewrite & expand on command
Any document. Any format.
PDF, URL, or YouTube → chat, quiz, podcast & more
Video Creation
Veo, Kling, Grok Imagine and more

Text to Speech
Natural AI voices, 30+ languages
Code Generation
Write, debug & explain code
Chat with Documents
Upload PDFs, analyze content
Your AI, in your pocket.
Full access on iOS & Android · synced everywhere
Your infinite AI canvas.
Chat, image, video & motion tools — side by side
Save hours of work and research
Transparent, High-Value Pricing
Trusted by teams at
Free
No credit card required
- 100 credits daily
- 3 AI models to try
- Basic AI chat
Plus
- 1,000,000 credits/month
- 25+ AI models — GPT, Claude, Gemini, Grok & more
- Agent Mode with web search, computer tools and more
- Creative Studio: image generation and video generation
- Project Library: chat with document, website and youtube, podcast generation, flashcards, reports and more
- Workflow Studio and FocusOS
Professional
- Everything in Plus, and:
- 2,100,000 credits/month
- Pro-exclusive models (Claude Opus, Grok 4, Sonar Pro)
- Motion Tools & Max Mode
- First access to latest features
- Access to additional offers
What Our Users Say
Great Tool after 2 months usage
"I love the way multiple tools they integrated in one platform. Going in the right direction."
— simplyzubair
Best in Kind!
"The quality of data and sheer speed of responses is outstanding. I use this app every day."
— barefootmedicine
Simply awesome
"The credit system is fair, models are perfect, and the discord is very responsive. Quite awesome."
— MarianZ
Great for Document Analysis
"Just works. Simple to use and great for working with documents. Money well spent."
— yerch82
Great AI site with accessible LLMs
"The organization of features is better than all the other sites — even better than ChatGPT."
— sumore
Excellent Tool
"It lives up to the all-in-one claim. All the necessary functions with a well-designed, easy UI."
— AlphaLeaf
Well-rounded platform with solid LLMs
"The team clearly puts their heart and soul into this platform. Really solid extra functionality."
— SlothMachine
Best AI tool I've ever used
"Updates made almost daily, feedback is incredibly fast. Just look at the changelogs — consistency."
— reu0691