How to Analyze Qualitative Data for Actionable Insights
Learn how to analyze qualitative data with this practical guide. Discover coding, thematic analysis, and how modern tools can uncover deeper insights.
Analyzing qualitative data is all about taking non-numerical information—things like interview transcripts, open-ended survey responses, or even social media comments—and systematically breaking it down to find the important themes and patterns hiding inside. It's a journey from raw text to rich insights, transforming a mountain of words into a clear story that can actually guide your strategic decisions.
Unlocking the Story in Your Qualitative Data

Before you get lost in the weeds of different analysis methods, it’s crucial to understand what we're really doing here. This isn't about number-crunching. It's about interpreting the human experience locked away in words, observations, and narratives. Think of yourself as a detective for user sentiment, digging deep to uncover the "why" behind what people do.
The whole process is about bringing structure to messy, unstructured feedback. You're taking a jumble of customer quotes and turning them into organized, actionable intelligence. The goal is always to get past the surface-level comments and grasp the real motivations that drive your audience.
The Real Value of Qualitative Insights
Quantitative data is great for telling you what is happening. For instance, it might show that "75% of users dropped off at the checkout page." But it can't tell you why. That's where qualitative data comes in, revealing that "Users found the shipping options confusing and expensive." This context is everything when it comes to making meaningful improvements.
When you get good at this, the payoff is huge.
- You build deep customer empathy. You start to see the world through your users' eyes, connecting with their pain points and aspirations on a much more personal level.
- You drive smarter product development. The insights you uncover can directly inform feature prioritization, UX fixes, and your overall product roadmap.
- You create marketing that actually connects. By understanding the language your audience uses and what they truly value, you can craft messages that resonate instead of just making noise.
The core purpose of analyzing qualitative data is to find the story. Every piece of feedback is a clue. When you piece them together, you reveal a narrative that can guide your entire business strategy.
Modern Tools Make It Simpler
For a long time, this was a painstakingly manual process. I can remember spending hundreds of hours with sticky notes, highlighters, and massive spreadsheets. Thankfully, things have changed. Recent trends show that about 70% of organizations now mix qualitative and quantitative methods to get the full picture.
The arrival of AI-powered tools has been a game-changer, with many researchers reporting that these platforms can slash their analysis time by up to 60%. You can learn more about future trends in qualitative market research to see where things are headed.
Platforms like are leading this charge. Instead of you having to sort everything by hand, Zemith’s AI can help you spot initial themes, get quick summaries of long documents, and pull all your feedback into one organized workspace. This frees you up from the tedious admin work and lets you focus on what really matters: thinking critically and interpreting the data to make smart decisions.
Getting Your Data Ready for Analysis

Before you can even think about finding those game-changing insights, you’ve got to get your house in order. Diving straight into a pile of raw notes, audio files, and survey responses is a recipe for chaos. Trust me, I've seen it happen.
This prep stage is what separates messy, unreliable conclusions from the clear, actionable intelligence you’re after. It’s all about transforming that raw, varied data into a consistent, organized format you can actually work with. It's not the most glamorous part of the job, but getting it right saves you from massive headaches later on.
From Spoken Words to Searchable Text
So much of our richest data starts as spoken words—think customer interviews, team focus groups, or sales calls. The first real hurdle is . You need those conversations in a format you can scan, search, and code.
Some researchers swear by verbatim transcription, capturing every "um," pause, and nervous laugh. And they're not wrong; those nuances can be incredibly telling. But for most business needs, like sifting through customer feedback, a clean, readable transcript is far more practical.
You could transcribe it all by hand, but be warned: it's a grind. A professional transcriber typically needs four to six hours to get through just one hour of audio. That’s a huge time sink.
This is where technology really steps up. AI-powered services can slash that time from hours to minutes. If you want to get into the weeds, you can explore how preserves the important stuff without the manual labor. Platforms like Zemith are built for this—they don’t just transcribe the audio; they organize it into documents that are ready for analysis from the get-go.
Organizing for Clarity and Efficiency
With everything in text format, it's time to impose some order. Without a system, you'll be drowning in a sea of files with names like final_interview_notes_v2_final.docx. A simple data management plan is non-negotiable.
Start with a consistent naming convention for your files. Something that tells you exactly what the file is at a glance.
- Try this format:
2024-07-15_UX-Feedback-Study_Participant-01.docx
It seems small, but this habit makes finding specific data points a breeze as your project scales. It also creates a clear audit trail, which is always a good thing.
A well-organized dataset is the bedrock of rigorous analysis. It ensures you can easily access, query, and synthesize information without getting lost in administrative chaos, letting you focus entirely on uncovering insights.
Beyond just file names, think about creating a central hub for all your project materials. This is another spot where a dedicated platform makes a world of difference. Instead of juggling folders on Google Drive or Dropbox, Zemith lets you create dedicated "Projects" or "Libraries." You can dump all your interview transcripts, survey data, and even support tickets into one searchable workspace. Everything is interconnected and ready when you are.
Anonymizing Data to Uphold Ethics
This one is crucial. Protecting your participants' confidentiality isn't just a nice-to-have—it's an ethical must. Before you begin analysis, you have to scrub all personally identifiable information (PII) from your data.
Here’s a quick checklist of what to remove:
- Names: Swap them out for pseudonyms or simple codes like "Participant A" or "Customer 102."
- Company Names: Generalize them (e.g., "a tech startup") unless the specific name is critical to the study.
- Locations: Get rid of specific addresses or unique geographical details.
- Job Titles: Broaden them. "Senior VP of Marketing, EMEA" becomes "Marketing Manager."
This process does more than just protect privacy; it helps you, the analyst, focus on the patterns in the data itself, not the people behind it. A simple find-and-replace can do a lot of the heavy lifting here, but always—always—do a final manual review to catch anything you might have missed.
Choosing the Right Analysis Method
Once your data is prepped and ready, the big question looms: how are you actually going to make sense of it all? There's no one-size-fits-all answer here. The analysis method you pick fundamentally shapes the insights you'll uncover, making this a crucial strategic decision.
Think of it like choosing the right lens for a camera. A wide-angle lens gives you the big picture, while a macro lens hones in on the tiny, intricate details. In the same way, different analysis methods are built to bring specific kinds of patterns into focus. Your choice should always be driven by what you need to learn from your research.
The Most Common Analysis Frameworks
You’ll find a handful of well-established methods that researchers lean on. Thematic analysis is a crowd favorite—used by about 65% of researchers—because it's so flexible for finding patterns across different kinds of data. Content analysis, which focuses more on quantifying concepts, shows up in roughly 40% of studies. Other powerful approaches include narrative analysis and grounded theory, each serving a unique purpose.
For a deeper dive into these, you can explore various to see how they stack up.
Let's walk through the most practical ones for business and research.
Thematic Analysis: This is often the best place to start. The goal is simple: identify, analyze, and report patterns (or themes) in your data. It's less rigid than other methods, which makes it perfect for open-ended questions like, "What are the common pain points our customers mention in support calls?"
Content Analysis: This one is more systematic. It involves categorizing text to count how often certain words, phrases, or concepts appear. It's fantastic when you need to translate qualitative feedback into hard numbers, like tracking every mention of "slow performance" in app reviews over time.
Narrative Analysis: Here, the story is everything. You're looking at how people construct stories from their experiences—the plot, the characters, the sequence of events. It’s a powerful tool for understanding a customer's journey or building incredibly detailed user personas.
Grounded Theory: This approach is all about building a new theory from the ground up, letting the data lead the way. You start with no preconceived ideas. It's best for complex, exploratory research where existing theories just don't seem to fit.
Before we dive into matching these methods to your goals, let's compare them side-by-side.
Comparing Qualitative Analysis Methods
Choosing the right approach can feel daunting, but it becomes much clearer when you see their goals and strengths laid out. This table breaks down the most common methods to help you decide which one best fits your research needs.
As you can see, the "best" method truly depends on what you're trying to achieve—whether that's finding broad patterns, counting specific terms, understanding individual stories, or building a new theory from scratch.
Matching the Method to Your Goal
The theory is one thing, but what does this look like in practice? It’s all about aligning the method’s strengths with your specific research objective.
Let's say you're a UX researcher staring at a pile of 50 interview transcripts about a new product feature. Your goal is to get a holistic view of the user experience—what people liked, what frustrated them, and what they found confusing. In this scenario, thematic analysis is your go-to. You'd read through the transcripts, tag comments related to "ease of use" or "feature discovery," and then cluster those tags into broader themes that tell a clear story.
Now, picture a marketing team trying to sift through 1,000 social media comments to figure out which brand message is hitting home. Here, content analysis is the perfect tool. They could create categories for each message—"Innovative," "Reliable," "Affordable"—and tally how many comments fit into each, giving them concrete numbers to back their next campaign.
Your choice of method isn't just a procedural step; it's a strategic decision that determines the depth and type of insight you'll gain. Choose the method that best answers your core research question.
This visual breaks down how we move from raw data to refined themes—a process that's central to both grounded theory and thematic analysis.
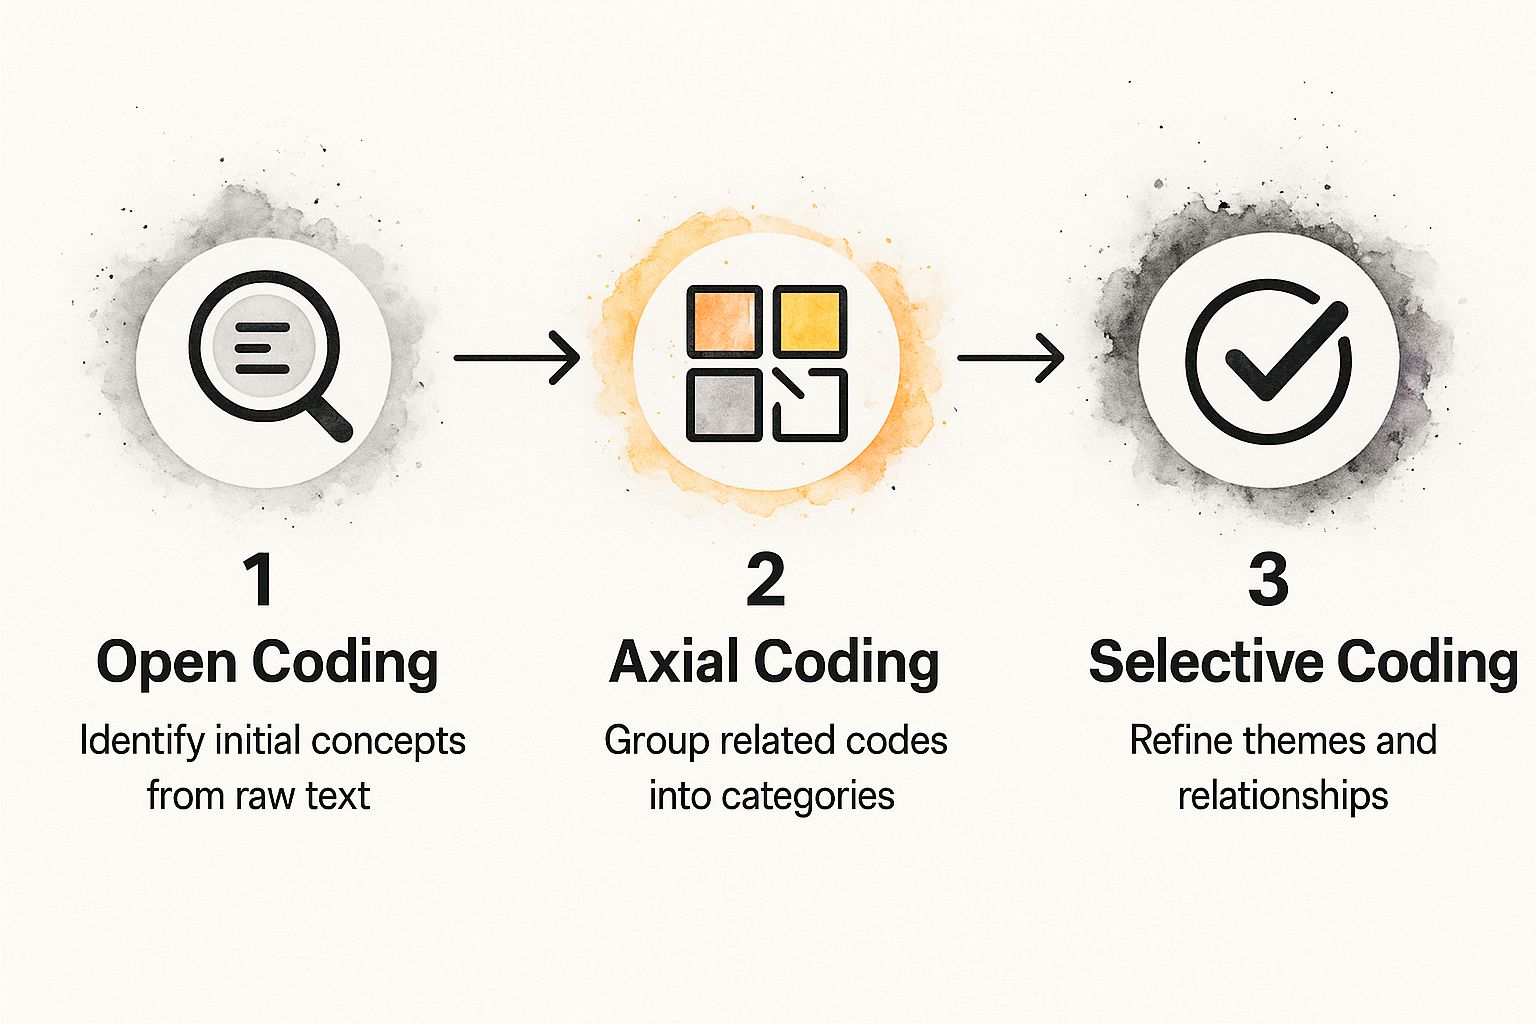
This flow really illustrates how the analysis starts with small concepts, groups them into meaningful categories, and finally connects them into a coherent theory or set of themes.
How Modern Tools Simplify Method Selection
The good news is that modern platforms like Zemith don't force you into a single methodological box. They give you flexible tools that can support multiple approaches. For example, you can use its powerful search and tagging for a thematic analysis, or you could set up a more rigid coding system for a content analysis project. The AI can even suggest initial codes and themes, giving you a huge head start no matter which path you take.
This isn't just academic. Companies like Atlassian use this kind of flexible analysis on tens of thousands of customer feedback snippets every month to guide their product roadmap.
When you think about it, this kind of systematic approach to qualitative information is vital across almost every business function. For instance, in HR, it's used for candidate selection. You can see how these principles apply in different contexts by reviewing resources like these , which highlights just how critical a structured approach is.
The Practical Art of Coding Your Data

This is where the real work begins. Coding is the methodical process of sifting through your raw data—interview transcripts, open-ended survey answers, customer feedback—and tagging key phrases or sentences with short, descriptive labels. Think of it as creating a detailed index for your text. It’s how you start to make sense of the chaos.
This isn’t just about highlighting interesting quotes. It's a structured approach that breaks down intimidating walls of text into small, manageable chunks of meaning. By assigning these "codes," you start to see the first glimmers of patterns that were completely invisible before.
Starting with Open Coding
Your first pass through the data is all about exploration. We call this open coding, and the goal is to keep an open mind and absorb what the data is telling you. As you read through the text line by line, you’ll assign a code to any concept, idea, or emotion that feels significant.
Don't worry about creating a perfect system at this stage. Your initial codes will likely be messy and descriptive, and you'll have a lot of them. It's perfectly normal.
For instance, if a participant says, "I found the checkout process confusing because I couldn't see the shipping costs upfront," you might jot down codes like:
Checkout confusionHidden shipping costsLack of transparency
The point is to capture the essence of what was said without filtering it through your own assumptions. This unfiltered approach is absolutely critical for unearthing those unexpected insights that challenge what you thought you knew.
Building Your Codebook for Consistency
As you work your way through the data, you’ll start noticing similar ideas popping up again and again. This is your cue to create a codebook, which will quickly become your most important tool. A codebook is simply a central document that lists all your codes, provides a clear definition for each one, and includes an example of how it's applied.
A basic codebook might look something like this:
This document ensures that you—and anyone else on your team—apply codes in the exact same way across the entire dataset. It’s your defense against "coder drift," where the meaning of a code subtly changes over time, which can completely undermine the reliability of your findings.
Your codebook is more than just a list; it's the rulebook for your analysis. It guarantees rigor and ensures that when you identify a theme, it's based on a consistent interpretation of the data, not just a gut feeling.
From Initial Codes to Deeper Categories
Okay, you've finished your first pass of open coding and now you have a very long list of codes. What’s next? The next step, often called axial coding, is all about organizing. You’ll start grouping those specific, granular codes into broader, more abstract categories. This is how you begin building the foundation for your final themes.
For example, you might look at your list and find these three codes:
Confusing navigationButtons are too smallCan't find the search bar
On their own, they're just individual problems. But together, they clearly point to a bigger issue. You can group them all under a higher-level category like Usability Issues. This process is the bridge between what individual people said and what it all collectively means for your project.
Blending Human Insight with AI Acceleration
Let's be honest: traditional coding can be an incredibly manual and time-consuming slog. A single hour-long interview can easily generate dozens of pages of text. Manually coding hundreds of survey responses could take weeks. This is where modern tools can genuinely change the game without compromising the quality of your analysis.
Think of AI as a research assistant, not a replacement for your own critical thinking. Platforms like use advanced models to handle the most repetitive, labor-intensive parts of coding. For example, Zemith's AI can do a first pass on your documents, suggesting potential codes and flagging recurring patterns you might have otherwise missed.
This human-AI partnership gives you the best of both worlds. The AI does the heavy lifting of the initial sort, freeing you up to focus on the nuanced work of interpreting meaning, refining categories, and connecting the dots. It transforms the tedious task of sifting through data into a much more dynamic exploration, letting you get to powerful insights faster.
Turning Codes into Actionable Insights
So, you've waded through a mountain of text and have a neat list of codes. That's a huge step. You’ve successfully broken down raw, messy data into organized, meaningful chunks. But codes are just the building blocks. The real magic happens when you start piecing them together to tell a story.
This is where you shift from just identifying concepts to synthesizing them into the broader themes that actually answer your research questions. It’s a process of interpretation—stepping back from the line-by-line details to see the bigger picture. You're hunting for connections, relationships, and recurring patterns that tie your individual codes together. Honestly, it’s less of a rigid science and more of a structured art form, driven by your own curiosity and research goals.
From Clusters to Compelling Themes
Think of your codes as puzzle pieces scattered on a table. Your job now is to start grouping them into logical clusters.
For example, say you're analyzing feedback for a new software feature. You might see codes like confusing UI, slow load times, and missing tutorial popping up again and again. Taken individually, they're just problems. But when you group them, you start to see a theme emerge, something like "Onboarding Friction Reduces User Adoption."
That’s the heart of thematic analysis. You aren't just making a list of problems; you're defining the overarching issue they all point to. A solid theme should be concise, descriptive, and speak directly to what you set out to learn.
Here are a few techniques I’ve found really useful at this stage:
- Mind Mapping: Get visual. Grab a whiteboard or a digital tool and map out your codes. Start drawing lines and arrows between related concepts to literally see how they connect.
- Code Frequency: Keep an eye on which codes appear most often. While frequency isn’t everything, it’s usually a strong clue that you’re onto a significant theme.
- Look for Contradictions: Sometimes the most valuable insights are hiding in the data that doesn't fit the pattern. If most users love a feature but a small, vocal group hates it, that contradiction is a theme worth digging into.
The goal is to weave a narrative. A simple list of findings is just information. A story built around clear themes is what creates understanding and, more importantly, inspires action. It’s the difference between saying, "Users mentioned these five problems," and "Users are struggling with initial setup, which is leading to early churn."
The Power of Trend Analysis
As you’re pulling your themes together, you're also doing a bit of trend analysis. This is all about spotting patterns that show up across different data sources or change over time. You might notice, for instance, that "requests for mobile access" are showing up more and more in customer support tickets over the last six months.
In fact, something like 75% of qualitative researchers lean on trend analysis to track these kinds of shifts. And with so much feedback coming from digital sources, this has become even more powerful. Online surveys have cut data collection costs by up to 35% and allow us to capture feedback in real-time. By tracking themes over time, you can move from a static snapshot to a dynamic understanding of your audience.
Visualizing Your Insights with Impact
Once you’ve nailed down your key themes, you have to present them in a way that people will actually pay attention to. Let's be real: a wall of text in a report is where good insights go to die. This is where visualization becomes your best friend.
This is an area where tools like Zemith really shine. Instead of just spitting out a list of codes, its visualization features can build charts, word clouds, and relationship maps that make your data come alive.
Imagine showing a stakeholder a network graph that visually connects "poor documentation" to a high volume of "support tickets." That single image can land your point more powerfully than a ten-page document ever could.
Visualizing your themes helps everyone see the big picture instantly. It highlights the most dominant ideas, shows how different concepts are interconnected, and makes your recommendations far more persuasive. To really make your findings stick, it pays to follow some key principles. For a deeper dive, check out our guide on . Ultimately, turning raw data into a clear, strategic recommendation is the final, most crucial step.
Common Questions About Qualitative Analysis
Even with a solid plan, a few questions always seem to surface once you're deep in the work. Let's walk through some of the most common hurdles I've seen researchers face, so you can tackle them with confidence.
Can You Analyze Small Sample Sizes?
Yes, absolutely. This is probably one of the biggest misconceptions about qualitative work. The goal here isn't breadth; it's depth. You can uncover incredibly powerful insights from just 5 to 10 rich, in-depth interviews.
What matters isn't the raw number of participants, but the quality and richness of the data you get from each person. A small, well-chosen group can tell you far more about deep-seated motivations and behaviors than a massive survey ever could. You're looking for the point of "saturation"—that moment when new interviews aren't bringing new themes to the surface.
A small sample isn't a limitation; it's a strategic decision. Concentrate on getting detailed, contextual stories, not just a high participant count. In this kind of analysis, quality beats quantity every single time.
How Do You Ensure Findings Are Credible?
This is a critical question, especially when your analysis is going to drive important business decisions. Unlike quantitative data, where you have statistical significance to lean on, credibility in qualitative research comes down to showing your work and being transparent about your process.
Here are a few practical ways to build that trust:
- Keep a Detailed Audit Trail: Think of it as your research journal. Document every step—how you developed your codes, why you defined a theme a certain way, and any shifts in your thinking.
- Bring in a Colleague: Ask another researcher to review your codes, themes, and interpretations. A fresh pair of eyes is one of the best ways to catch your own biases or find connections you might have overlooked.
- Triangulate Your Data: Don't rely on just one source. If the feedback you're hearing in interviews also pops up in support tickets or online reviews, you can be much more confident in that theme.
Should I Use Software or Do It Manually?
For a tiny project—maybe analyzing a few short interview transcripts—you can probably get by with a spreadsheet or even physical sticky notes. But as soon as your dataset has any real size to it, software isn't just a nice-to-have; it's a necessity for doing rigorous work efficiently. Trying to manage dozens of transcripts by hand is a recipe for frustration and missed insights.
Modern tools are built to handle this complexity. They keep everything organized, speed up the coding process, and help you see connections that are nearly impossible to spot manually. This is where AI-powered platforms really shine, taking over the tedious parts so you can spend your time thinking and interpreting. The real question isn't whether AI can replace a human analyst, but how it can enhance our own skills and make the entire process more powerful.
Ready to stop wrestling with spreadsheets and find insights faster? Zemith is an AI workspace designed to help you organize your research, speed up your coding, and present your findings with clarity. It’s time to build a centralized knowledge base for all your qualitative data. .
Explore Zemith Features
Every top AI. One subscription.
ChatGPT, Claude, Gemini, DeepSeek, Grok & 25+ more


Always on, real-time AI.
Voice + screen share · instant answers
What's the best way to learn a new language?
Immersion and spaced repetition work best. Try consuming media in your target language daily.
Voice + screen share · AI answers in real time
Image Generation
Flux, Nano Banana, Ideogram, Recraft + more

Write at the speed of thought.
AI autocomplete, rewrite & expand on command
Any document. Any format.
PDF, URL, or YouTube → chat, quiz, podcast & more
Video Creation
Veo, Kling, Grok Imagine and more

Text to Speech
Natural AI voices, 30+ languages
Code Generation
Write, debug & explain code
Chat with Documents
Upload PDFs, analyze content
Your AI, in your pocket.
Full access on iOS & Android · synced everywhere
Your infinite AI canvas.
Chat, image, video & motion tools — side by side
Save hours of work and research
Transparent, High-Value Pricing
Trusted by teams at
Free
No credit card required
- 100 credits daily
- 3 AI models to try
- Basic AI chat
Plus
- 1,000,000 credits/month
- 25+ AI models — GPT, Claude, Gemini, Grok & more
- Agent Mode with web search, computer tools and more
- Creative Studio: image generation and video generation
- Project Library: chat with document, website and youtube, podcast generation, flashcards, reports and more
- Workflow Studio and FocusOS
Professional
- Everything in Plus, and:
- 2,100,000 credits/month
- Pro-exclusive models (Claude Opus, Grok 4, Sonar Pro)
- Motion Tools & Max Mode
- First access to latest features
- Access to additional offers
What Our Users Say
Great Tool after 2 months usage
"I love the way multiple tools they integrated in one platform. Going in the right direction."
— simplyzubair
Best in Kind!
"The quality of data and sheer speed of responses is outstanding. I use this app every day."
— barefootmedicine
Simply awesome
"The credit system is fair, models are perfect, and the discord is very responsive. Quite awesome."
— MarianZ
Great for Document Analysis
"Just works. Simple to use and great for working with documents. Money well spent."
— yerch82
Great AI site with accessible LLMs
"The organization of features is better than all the other sites — even better than ChatGPT."
— sumore
Excellent Tool
"It lives up to the all-in-one claim. All the necessary functions with a well-designed, easy UI."
— AlphaLeaf
Well-rounded platform with solid LLMs
"The team clearly puts their heart and soul into this platform. Really solid extra functionality."
— SlothMachine
Best AI tool I've ever used
"Updates made almost daily, feedback is incredibly fast. Just look at the changelogs — consistency."
— reu0691